Where is your cash going?
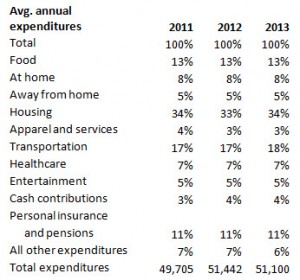
It goes without saying that budgeting is a prerequisite for financial success. But, what should your budget look like? Data below from the Bureau of Labor Statistics, gives us a clue into how the average U.S. household budget is allocated:
After the expenditures illustrated above, how much is left for saving and investing? The Federal Reserve Bank details the U.S. personal saving rate (which measures the difference between disposable income and consumption) as of recent hovers near the mid-single digits or roughly 5%. This is markedly lower than the double digit rates from a couple generations ago. Inflation (or the increase in prices for goods and services) has played a part on the trend line but so has culture. Is the U.S. savings rate too low? Stats from the OECD illustrate the saving rates in the U.S. are lower than the average of other industrialized countries.
Are Americans spending too much on cars, homes and student loans?
In Extraordinary Popular Delusions and the Madness of Crowds, Scottish writer Charles Mackay chronicles misfortunes of following the herd for financial advice. When it comes to how to allocate cash, conventional wisdom can be an oxymoron.
In summary,the path to financial independence will require not just building budgets, but building them different from the averages (shown above). Hence, the need to hack conventional thinking and actions around cash. More to come!

Leave a comment